AMFI, the mutual fund industry body, publishes close to 13,991 individual schemes spread across 89 differently-worded category strings — think 'Large Cap Fund', 'Multi Cap Fund', 'Flexi Cap Fund' and dozens of debt and hybrid variants, each with its own exact label. Nobody scans a table of 89 rows every day. The /funds page folds that into roughly two dozen readable buckets and renders them as a single heatmap, updated once a trading session has settled.
What a tile's size and colour actually mean
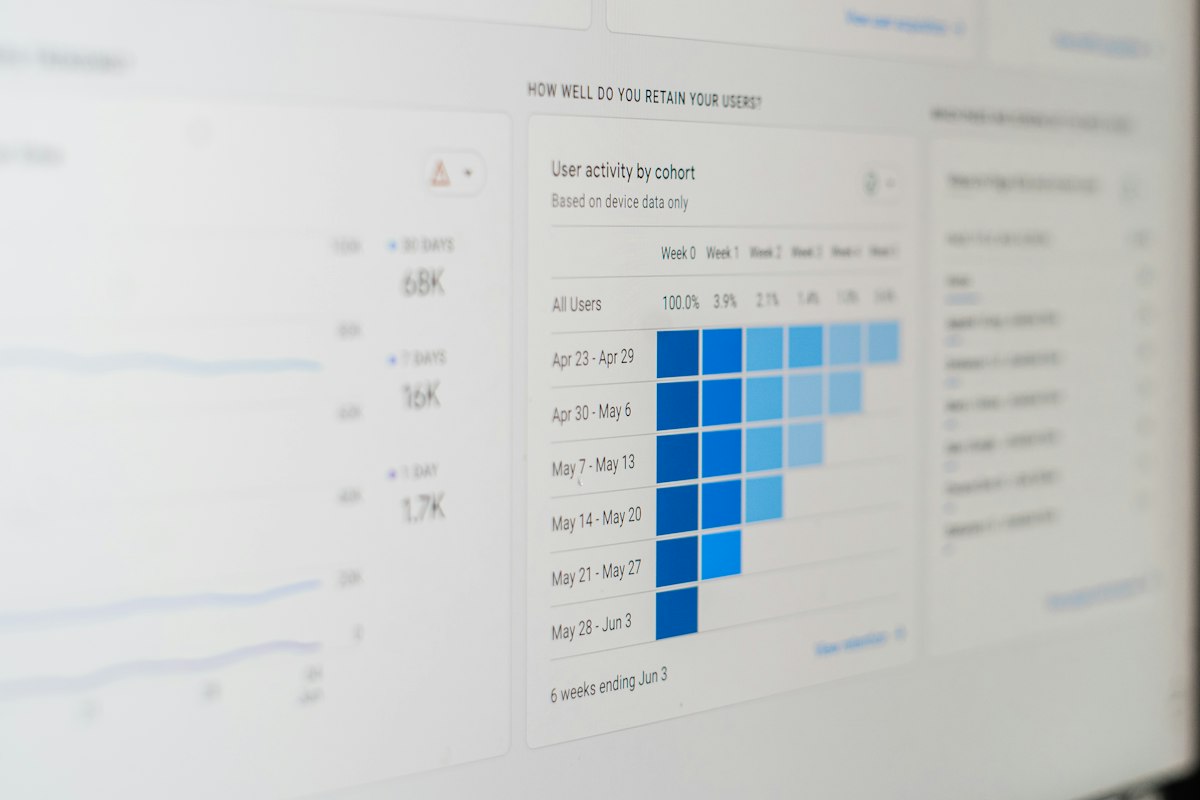
Tile size reflects how many schemes sit inside that category — a bucket with hundreds of schemes gets a visibly larger tile than a niche category with a handful. Colour reflects the category's average one-day change, calculated per scheme and then averaged across the category, rather than compared at the category's aggregate NAV level. Every tile also prints its actual percentage number, specifically so the direction of the move never depends on reading a colour correctly on a screen that might render it differently.
Best and worst category, called out directly
Rather than making you scan every tile to find the extremes, the page separately states the best-performing and worst-performing category for the session. That's a convenience layer on top of the heatmap, not a different calculation — it's the same per-scheme average change, just pulled out and labelled for the two categories at either end.
Why this beats checking individual fund NAVs
- A single scheme's NAV move can be driven by one or two large holdings; a category average, across potentially dozens of schemes, cancels out a lot of that single-fund noise.
- Comparing categories side by side on one page is faster than opening fifteen different fund NAV pages one at a time.
- The category view is a starting point for narrowing down, not a replacement for checking a specific scheme's own factsheet before you act on anything.
The heatmap updates once the market-data job for a session has run; until then the page simply shows the most recent completed session rather than a partial, misleading one.
Open the fund category heatmap →Common questions
Why does AMFI have 89 category strings if /funds only shows about 24?
AMFI's 89 strings include many near-duplicate or narrowly-worded labels across AMCs; fdNormaliseCategory() folds those into roughly two dozen readable buckets so the heatmap is actually scannable in a few seconds.
Is the heatmap colour based on NAV or on scheme-level change?
Scheme-level average one-day change, not the category's aggregate NAV. That choice avoids one or two very large schemes dominating a whole category's displayed colour.
Does the heatmap cover debt fund categories too, or only equity?
It covers whatever AMFI categories exist across the roughly 13,991 schemes, folded into readable buckets -- that includes equity, debt and hybrid categories, not equity alone.
Thousands of AMFI schemes, folded into roughly two dozen readable categories, sized by scheme count and coloured by average daily change -- that's the whole mechanism behind the /funds heatmap. It's a fast way to see what's moving across the fund universe, and a starting point for narrowing down, not a replacement for checking a specific scheme's own factsheet.