Markets benchmarks trade mixed
· Indian markets · End-of-day close
How did the Indian stock market perform on 28 October 2026?
Nifty 50 closed at 22,698.85 (-0.22%). Auto led sectors at +1.45%. Telecom lagged at -2.27%. 2,473 stocks advanced against 2,313 declines.
What mattered today
- Auto was the strongest sector at +1.45%
- Telecom was the weakest at -2.27%
- Advance–decline ratio of 1.07:1 across 5,032 traded stocks
- India VIX eased to 16.25 (-0.91%)
- Jio Platforms Limited saw the highest traded value, 23.44% of the day's turnover
- Open Ended Schemes(Other Scheme - Gold ETF) funds averaged +0.99% across 15 schemes
Market breadth
How many stocks rose versus fell across 5,032 traded counters
Sector scoreboard
Every NSE sectoral index, ranked by today's move · 1-week & 1-month view →
Five-session momentum
Sector change since 24 Oct
Stocks of the day
Liquid counters only — above ₹1 crore turnover, so single-trade spikes are excluded
Where the money went
Highest traded value · total turnover ₹9,791 crore
Mutual fund categories
Average NAV move across 86 categories
Go deeper
Share today's report
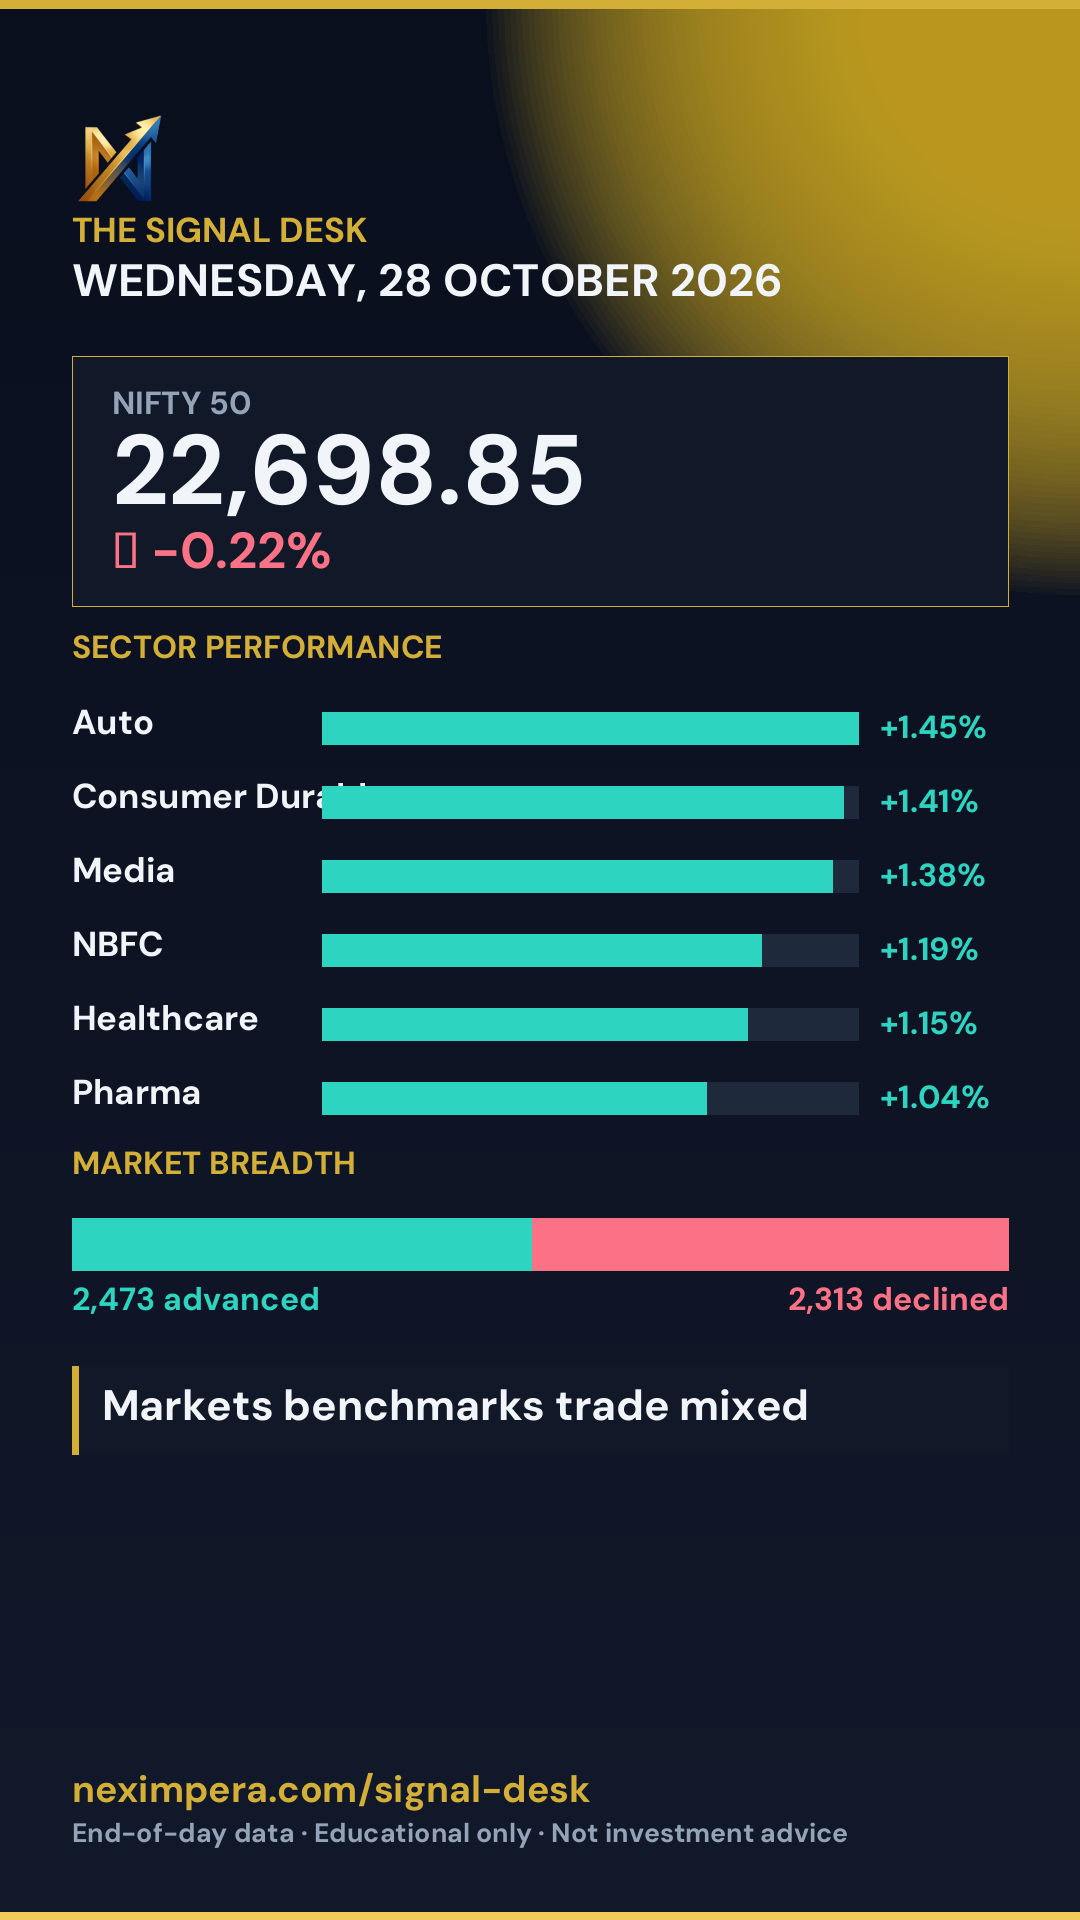
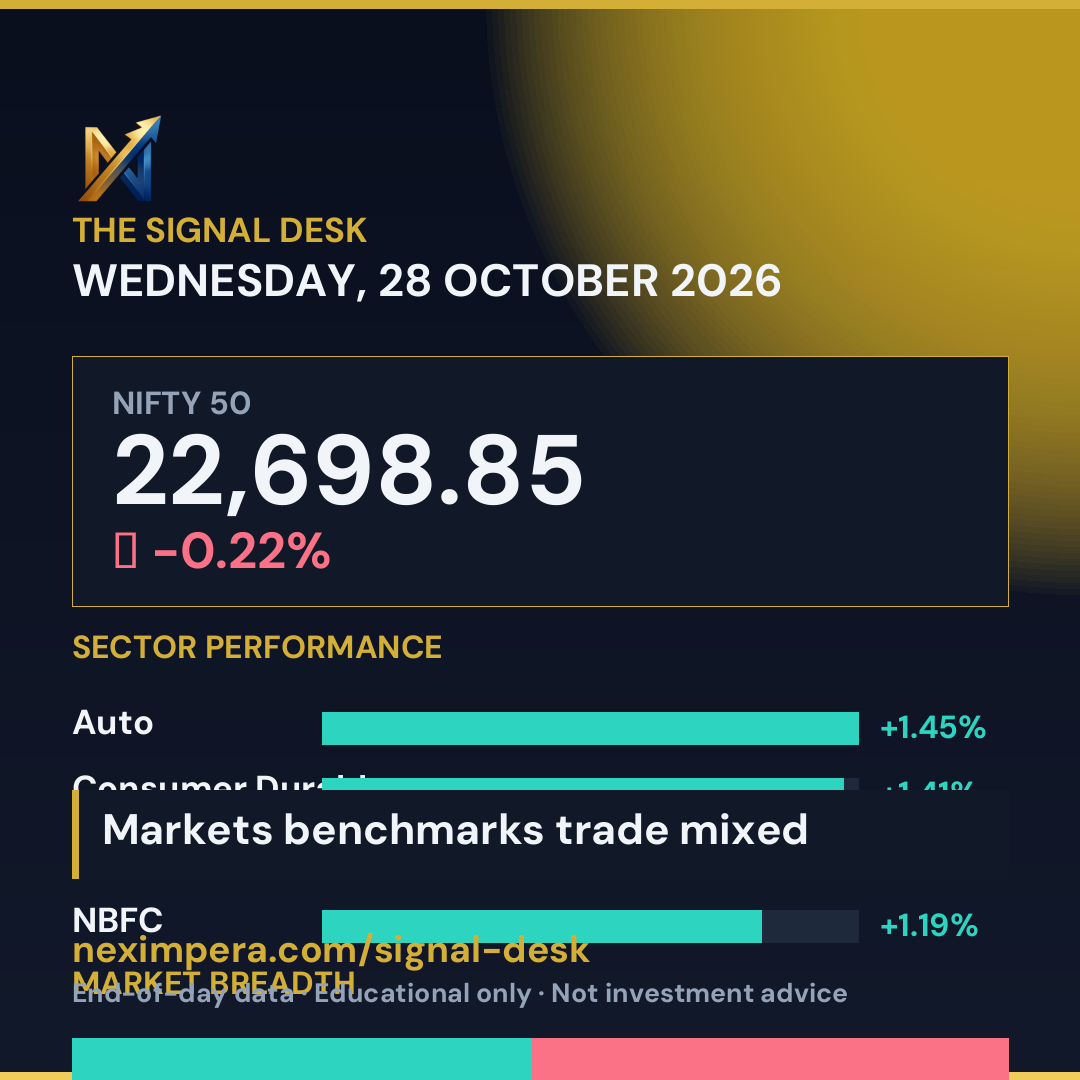
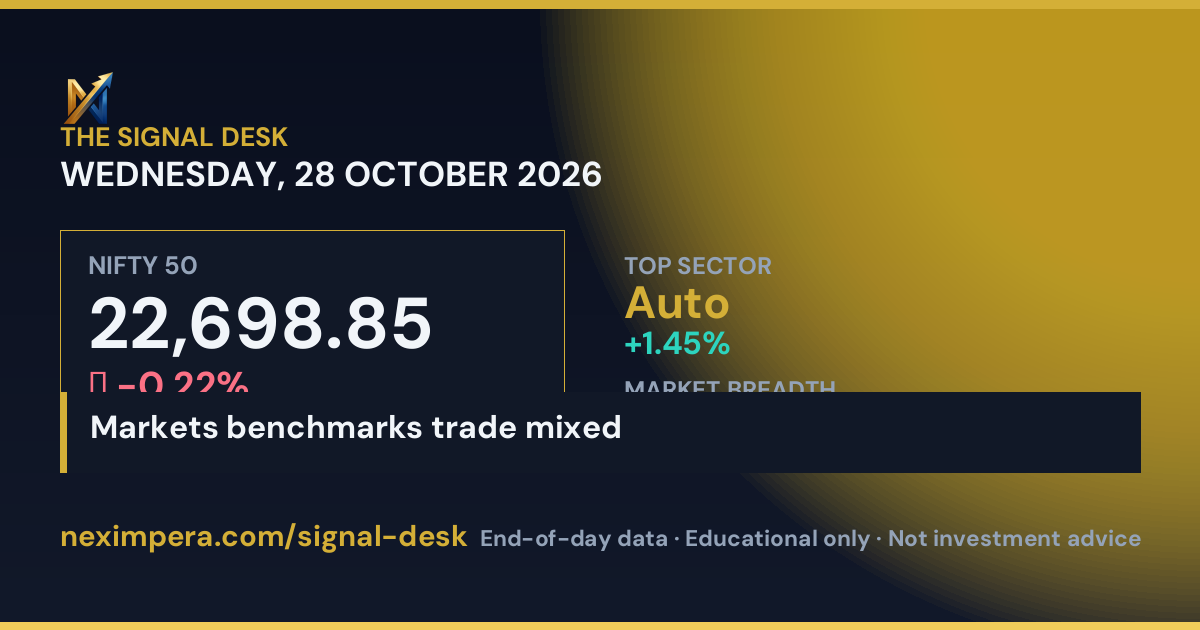
Story size fits Instagram Stories, WhatsApp Status and Facebook Stories.
Past reports
Frequently asked
Where did the Nifty 50 close on 28 October 2026?
The Nifty 50 closed at 22,698.85, a change of -0.22% from the previous session.
Which sector performed best on 28 October 2026?
Auto was the strongest NSE sectoral index, closing +1.45%. The weakest was Telecom at -2.27%.
How many stocks rose or fell on 28 October 2026?
2,473 stocks advanced and 2,313 declined out of 5,032 traded on the BSE, an advance-decline ratio of 1.07:1.
Which stock gained the most on 28 October 2026?
HUHTAMAKI INDIA LIMITED (HUHTAMAKI) rose +19.98% to close at ₹229.65, among stocks with more than ₹1 crore of turnover.
Educational only · Not investment advice. Figures are official end-of-day data published by AMFI, BSE and NSE, and are delayed — not live quotes. This report describes what already happened; it contains no forecast, recommendation or opinion on any security. NexImpera is not a SEBI-registered investment adviser or research analyst. Community figures reflect activity in a simulated-money practice portfolio and involve no real trades. Past performance does not indicate future results. Mutual fund investments are subject to market risks; read all scheme-related documents carefully.